



Most token launches look identical for about six hours. Green candle, listing thread, screenshots of the chart, a Telegram channel adding members every second. Then the sample splits, and it splits hard.
The numbers behind that split are not subtle. DWF Labs reported that 84.7% of tokens launched in 2025 were trading below their TGE price, with median fully diluted valuation down 71% since launch. Of 28 launches that debuted at a $1 billion FDV or higher, none were in profit. Delphi Digital went further back in its State of Token Markets report, tracking 542 tokens launched since 2020, and found the average token spends roughly 70% of its life below its launch price.
So the interesting question is not why launches fail. It is what the small group that held price did differently, and whether those decisions are repeatable.
We looked at 100 launches across L1s, L2s, DeFi protocols, infrastructure plays and consumer apps, tracking each one from private round through day 180. The tokens that held their listing price were not the ones with the best narrative or the biggest listing. They were the ones that made five specific structural choices before a single candle printed.
- Launch valuation and float set the ceiling. Tokens that opened with a modest FDV and a genuinely tradeable float had room to grow into their price instead of falling back to it.
- Unlock size relative to real order book depth predicted drawdowns better than unlock size in dollars, and Keyrock found 90% of unlocks push prices down regardless of recipient.
- Demand has to be structural. Distribution that rewards behaviour and a token that captures protocol revenue held price far better than listing announcements ever did.
The Six Hours Everyone Optimises For, and the Six Months Nobody Plans
Launch planning in crypto has been optimised almost entirely for a single day. Exchange coordination, market maker onboarding, KOL scheduling, the announcement cadence. All of it points at TGE.
The price data points somewhere else. Typical drawdowns for 2025 launches ran between 50% and 70% within 90 days of listing, and 83% of tokens listed on top centralised exchanges that year fell below their listing price. The pressure that kills a token almost always arrives after the launch team has moved on to the next milestone.
|
84.7% of 2025 token launches traded below their TGE price, per DWF Labs |
70% of an average token’s lifetime is spent below launch price, across 542 tokens studied by Delphi Digital |
90% of token unlocks create negative price pressure, from Keyrock’s study of 16,000+ unlock events |
Read those three figures together and the pattern is clear. The market is not rejecting new tokens on day one. It is grinding them down over the following two quarters, as supply arrives faster than demand.
What the Winners Did Differently
Across our 100 launches, the cohort that was still trading at or above listing price at day 180 was small. What made it worth studying is how consistent that group was. The same five decisions showed up again and again, and none of them were marketing decisions.
1. They priced the launch below what they could have got
Every project that held price left money on the table at TGE. Not by accident. Their teams chose a valuation the market could grow into rather than the highest number a private round would support.
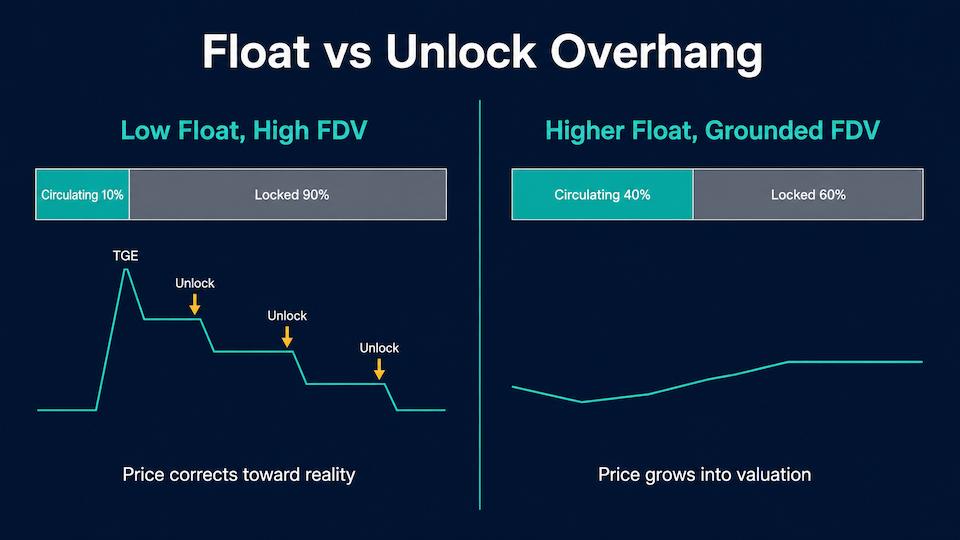
The alternative is well documented. Binance Research tracked 2024 launches and found a median market cap to FDV ratio of 12.3%, which means buyers were entering structures where 87.7% of supply was still locked. Thin float creates an artificial price. Every unlock after that is a correction toward the real one.
2. They sized float against liquidity, not against a target headline
The tokens that survived opened with enough circulating supply that the order book could absorb normal selling. That sounds obvious. In practice it means resisting the temptation to launch 3% of supply and celebrate a billion-dollar FDV that exists on paper only.
A useful test: if a single day of scheduled unlocks exceeds the dollar volume your book can absorb without moving price more than a few percent, your schedule is not a schedule. It is a countdown.
3. They made the market maker agreement boring
Two structures dominate market making term sheets. A retainer, where you pay a monthly fee for liquidity provision. And a loan plus call option, where you lend tokens to the market maker who holds the right to buy them at a fixed strike.
The loan plus call model looks free. It is not. When the strike sits well below where your token later trades, the market maker’s most profitable move is to exercise and sell. The Movement Labs MOVE situation in 2025 put this in public view when agreements, strike prices and chat logs surfaced, showing how a liquidity arrangement can become a channel for post-listing selling.
4. They paid for behaviour, not for wallet count
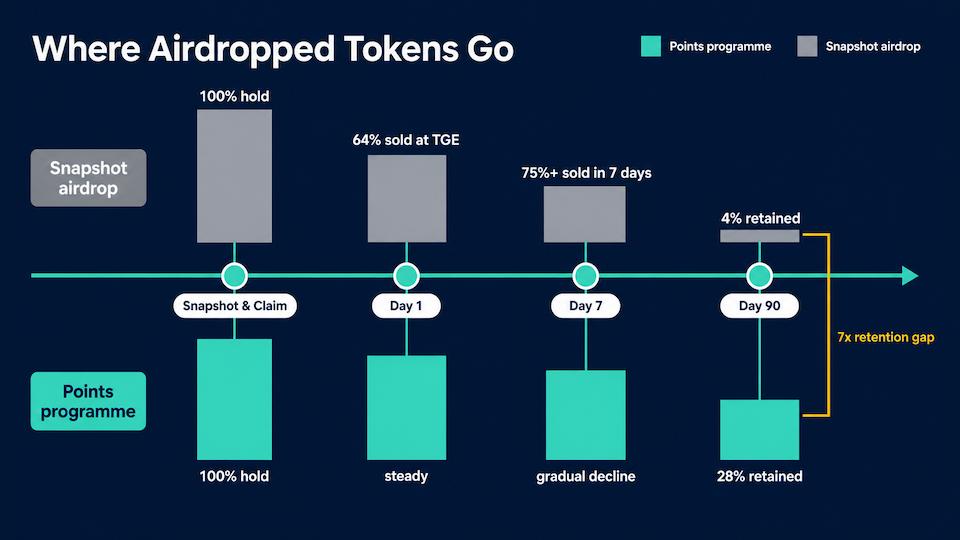
Distribution design showed up in the price chart within two weeks. On-chain analysis of more than two million airdrop addresses found 64% of recipients sold at TGE. For the 1inch airdrop, 66.09% of recipients moved tokens to an exchange within 24 hours. Over 75% of Uniswap airdrop recipients sold within seven days.
Projects that ran points programmes with multi-action eligibility saw far better outcomes. Audited protocols showed day-90 retention averaging 4% for simple snapshot airdrops, against 28% for points-based programmes requiring sustained activity.
5. They had demand that did not depend on the next listing
Listings are distribution, not demand. The tokens that held price had a reason to be bought after the listing thread stopped trending, usually fee capture, staking with real yield backed by revenue, or a buyback funded by actual income rather than treasury.
Held Price Versus Faded: The Structural Differences
Grouping the cohort by outcome makes the contrast easier to see. These are the variables that separated the two groups most cleanly.
| Variable | Tokens that held price | Tokens that faded |
| Initial float | Large enough for the book to absorb sellers | Minimal float engineered for a scarcity pop |
| Launch FDV | Set below what the round could justify | Anchored to the last private valuation |
| Unlock shape | Long cliff, then smooth linear release | Large cliffs clustered in months 6 to 12 |
| Market maker deal | Retainer with depth and uptime obligations | Token loan with an undisclosed call strike |
| Distribution | Points and multi-action eligibility, staged claims | One-shot snapshot airdrop, instant claim |
| Post-launch demand | Fee capture or revenue-funded buybacks | A pipeline of further exchange listings |
Unlock Design Is Product Design
Keyrock’s analysis of more than 16,000 unlock events is the most useful dataset published on this. It tracked daily price for 30 days either side of each unlock, and the findings should reshape how founders build vesting schedules.
Cliffs concentrate risk into a single date
When an entire batch becomes transferable at once, the market has one day to price a supply shock. Linear releases spread the same supply across months and, in Keyrock’s data, had a more positive market impact than cliffs.
The damage starts before the unlock
Price impact typically begins ahead of the unlock date as traders front-run a publicly visible calendar. Treating your unlock day as the risk window is a mistake. The window opens two to four weeks earlier.
Five percent is the line that matters
Unlocks exceeding 5% of circulating supply correlate with median price drops of 8% to 15% across the surrounding 30-day window. If any single event on your schedule crosses that threshold, split it.
The compounding is the real problem
Delphi found the typical token underperformed Bitcoin by about 7% per unlock. By the tenth unlock, that underperformance had compounded to roughly 47%. No amount of marketing outruns a schedule that dilutes faster than demand grows.
|
A vesting schedule is a promise to sell. The market reads it that way, and it starts pricing it in long before the tokens move. |
|
Is your vesting schedule built to survive month six? We stress-test unlock schedules against real order book depth before you commit to them publicly. |
Liquidity Is a Number, Not a Vibe
Most founders judge liquidity by spread. Spread alone tells you very little. A 5 basis point spread with a few hundred dollars sitting behind it is worse for traders than a 30 basis point spread with $100,000 of depth.
Ask for depth commitments in writing
Specify depth within a defined band on each side of mid price, the venues it applies to, and the uptime percentage. Vague obligations produce vague liquidity.
Understand what you are giving away
In a loan plus call structure, model the outcome at several future price levels. If your token triples and the strike sits at launch price, work out exactly how much supply the market maker can acquire cheaply and what that does to your book.
Fewer venues, deeper books
Projects in our cohort that spread thin liquidity across eight exchanges consistently underperformed those that concentrated it on two or three. Fragmented depth is fragile depth.
Disclose the arrangement
Teams that published the shape of their market making agreement, without necessarily naming commercial terms, faced fewer accusations when volatility arrived. Silence gets interpreted, usually unkindly.
Distribution Decides Your First Thirty Days
The first month of trading is mostly a referendum on who received tokens and why. DappRadar found that 88% of airdropped tokens lose value within three months, and the reason is behavioural rather than technical. People who were given something with no cost of acquisition sell it.
Reward duration, not moments
A snapshot rewards being present on one date. A points programme rewards being present over time. The retention gap between the two, 4% against 28% at day 90, is the largest single delta we found in any category.
Filter sybils before you allocate
Every token distributed to a farming cluster is a token that hits the order book in week one. Clustering analysis, funding-source graphs and behavioural scoring are cheaper than the price damage.
Stage the claim
Splitting a claim into tranches tied to continued usage removes the single-day sell wall and gives the token a reason to stay in the wallet. It also gives you real usage data instead of claim data.
Do not confuse activity with demand
Post-airdrop, protocol activity typically settles at 20% to 40% above pre-airdrop levels once claimants have cashed out. Plan your metrics around that reality rather than the spike.
The Demand Side Is Where Most Tokenomics Documents Go Quiet
Supply schedules get twenty pages. Demand gets a paragraph about governance. That imbalance shows up in the chart.
Revenue is not value accrual
Six major crypto protocols generated $7.42 billion in revenue in 2026 and their token prices still declined. Revenue only supports a token if the token has a claim on it. Write that mechanism into the design, not into the roadmap.
Buybacks work when they are funded by income
Crypto projects spent $638 million on token buybacks in 2026, with Hyperliquid and Pump.fun accounting for close to 90% of that. Hyperliquid routes roughly 99% of its trading fees into HYPE repurchases, with cumulative buybacks passing $2 billion. Uniswap has burned around 107 million UNI, about 11% of total supply.
Results are still mixed, and that is the lesson
Buybacks did not rescue every token that ran them. Where unlocks, incentive emissions and weak product usage outweighed the buying, price still fell. A buyback offsets sell pressure. It does not replace product-market fit.
Watch the supply curve against the demand curve
Plot projected circulating supply at 12, 24 and 48 months against projected fee accrual. If supply compounds faster, price has to fall to clear the extra float no matter how good the product gets.
A Ninety-Day Sequence That Survives Contact With the Market
The launches that held price ran a longer, quieter process than the ones that did not. Here is the sequence that showed up most often.
| T minus 90 |
Model the schedule, then break it Stress-test every unlock against conservative liquidity assumptions. Split anything above 5% of circulating supply. Fix the float and FDV before anyone sees a deck. |
| T minus 60 |
Negotiate liquidity on your terms Compare retainer and loan structures side by side at three future price levels. Lock depth, spread and uptime obligations into the contract. |
| T minus 30 |
Close the distribution list Run sybil filtering, finalise points weighting, and publish eligibility rules early enough that the community can challenge them. |
| TGE week |
Publish the full calendar Ship a public unlock dashboard on day one. Traders will find the schedule regardless. Controlling how it is presented is worth more than delaying it. |
| T plus 90 |
Report like a public company Quarterly revenue, buyback execution, treasury movements and holder cohort data. This is the material that keeps informed buyers in the book. |
Where This Leaves Founders Going Into the Next Cycle
The market has already adjusted. Crypto venture investment has fallen to around 12% of its 2022 level, community sales and fair launch formats are being used again, and buyers now check unlock calendars before they check the pitch deck. On the retail end, the picture is even more brutal: of 18.67 million tokens launched on Pump.fun between January 2024 and June 2026, only 4.55% were still actively traded past day 90, and 68.67% recorded their last trade on launch day.
None of that means launching is a bad idea. It means the bar moved. Structure is now the product, and the projects that treat tokenomics as a financial engineering problem rather than a marketing asset are the ones still trading above listing at month six.
That is the work Blockchain App Factory does with founding teams. End-to-end token launch services covering tokenomics modelling and unlock stress-testing, smart contract development and audit coordination, exchange and market maker negotiation, distribution and airdrop architecture with sybil filtering, and the post-launch reporting cadence that keeps serious holders in the book. The teams we work with usually come to us with a valuation target and a listing date. They leave with a supply curve that their demand curve can actually support, which is a less exciting conversation and a considerably better outcome.
|
What do the launches that hold price actually have in common? Bring us your token model and we will show you where it breaks before the market does. |
Frequently Asked Questions
What percentage of circulating supply should a token launch with?
There is no universal number, but the failure pattern is well established. Binance Research found a median market cap to FDV ratio of 12.3% for 2024 launches, meaning nearly 88% of supply was locked. Float should be sized so the order book can absorb routine selling without dislocation, which usually means considerably more than the low single digits many projects choose.
Do cliff unlocks always damage price?
Keyrock’s study of over 16,000 unlock events found that 90% of unlocks create negative price pressure, and cliffs carry the sharpest event risk because the whole batch becomes transferable at once. Linear releases showed a more positive market impact, though they add steady dilution that compounds month over month.
Are airdrops still worth running?
Yes, if they reward sustained behaviour. Snapshot airdrops averaged 4% retention at day 90 across audited protocols, while points programmes with multi-action eligibility reached 28%. The mechanism matters more than the size of the allocation.
Should we choose a retainer or a token loan for market making?
A retainer costs a predictable monthly fee and carries no dilution risk. A loan plus call option looks cheaper upfront but can become the largest cost in your launch budget if the strike sits far below where your token later trades. Model both at multiple future prices before signing.
Can buybacks hold a token price on their own?
Not reliably. Crypto projects spent $638 million on buybacks in 2026 with mixed results, and six major protocols generated $7.42 billion in revenue that year while their tokens still declined. Buybacks offset sell pressure. They do not fix a supply schedule that outruns demand.

Vimal J is the Head of Sales at Blockchain App Factory, with 10+ years of experience in sales, client strategy, and Web3 business growth. He helps startups, enterprises, and project founders choose the right blockchain solutions for their goals, bringing a practical market perspective to topics like token development, crypto launches, and Web3 adoption.
Article Reviewed by:
Arun Kamala Santhanath
Marketing Head, Blockchain App Factory


